
Location-based Maps#
What is a Location Based Map?#
Location based maps are a specific type of heat map (see above for a description of heat maps). One of your measures must be a location variable (e.g., cities, counties, states, countries, etc.) and the other variable must be ordered. The larger the value is for a particular location the darker the location is on the map. See Illustration 1 for an example of a Location Based Map.
Illustration 1: Location Based Map of State Income Tax Rates in the lower 48 states#
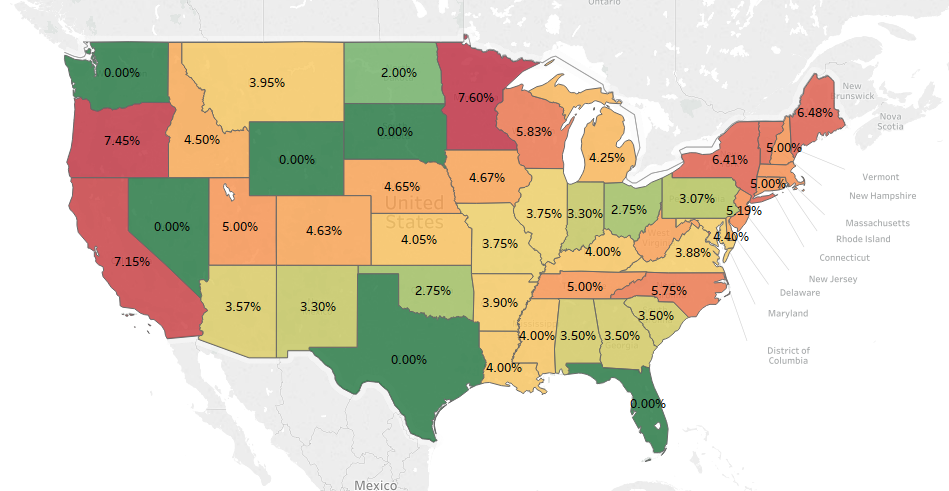
Illustration 1 displays the income tax rates by state. Most states have a range of taxes based on the level of income you earn, so the percent in this visualization is the midpoint of the range. This heat map displays the use of different colors instead of shades of the same color. The red is the highest tax rate (including places like California, Oregon and Minnesota) while the green is the lowest tax rate (including places with no income tax like Washington, Texas and Florida to name a few).11
When to Use a Location Based Map#
Just as with Heat Maps above, Location Based Maps are used for comparisons. Specifically, location based maps are useful when you are interested in comparing a variable by location.
Creating a Location Based Map in Tableau#
Watch this video to learn about location-based maps in Tableau: