Types of Data#
Not all data is created equal. The way data is organized profoundly impacts how we can use it. To effectively analyze data, we must first understand its structure. We can broadly categorize data into three main types:
Unstructured
Semi-structured
Structured
This chapter will give you an overview of these three types of data. We will end this chapter with a look at tabular data, a type of structured data. In this class, we will focus exclusively on analyzing tabular data.
Unstructured Data: The Wild Frontier#
Imagine a vast, untamed wilderness. That’s a good analogy for unstructured data. It’s the most common and often the most challenging type of data to work with because it lacks a predefined format or organization. There’s no strict format dictating how it should be stored or what elements it should contain.
Characteristics of Unstructured Data#
It doesn’t fit neatly into traditional rows and columns.
It can come in many forms.
It is often generated by and for human consumption, making it rich in context but difficult for machines to parse without advanced techniques.
Examples of Unstructured Data#
Text Documents: Emails, Word documents, PDF files, articles, books, research papers, customer reviews. Think of the content of an entire library – rich in information but not easily quantifiable into categories without effort.
Videos, photos, and music: Images , audio recordings, video files. A photograph, for instance, contains visual information, but extracting specific features like “a red car” or “a smiling person” requires sophisticated computer vision algorithms.
Social Media Content: Posts, tweets, comments, likes. The free-form nature of social media updates makes them highly unstructured.
Sensor Data: While sometimes appearing structured, raw sensor data streams (e.g., from IoT devices before processing) can be considered unstructured due to their continuous, often varied, and high-volume nature.
Analyzing unstructured data typically requires advanced techniques such as Natural Language Processing (NLP) for text, or machine learning and artificial intelligence for image and audio recognition. It’s a goldmine of information, but extracting value requires specialized tools and expertise.
Semi-structured Data: Bridging the Gap#
Sitting between the chaos of unstructured data and the rigid order of structured data is semi-structured data. This type of data uses tags or markers to create a hierarchical structure, but it doesn’t conform to a strict format like a traditional database. It’s self-describing, meaning the structure is embedded within the data itself.
Characteristics of Semi-structured Data#
Self-Describing: The data contains information about its own structure.
Flexible Structure: The structure can vary slightly from one record to another, offering more flexibility than fully structured data.
Hierarchical: Often organized in a tree-like structure.
Example#
The best example of semi-structured data for an accounting audience is XBRL (eXtensible Business Reporting Language). It is a modern way of communicating business and financial data. It uses tags in a document to describe items in financial statements. This makes it much easier to work with accounting data. In the old days, financial statements were stored in PDFs, and every company used a different format. Now, with XBRL tags in financial statements, it is much easier to search for, say, a company’s leasing footnote.
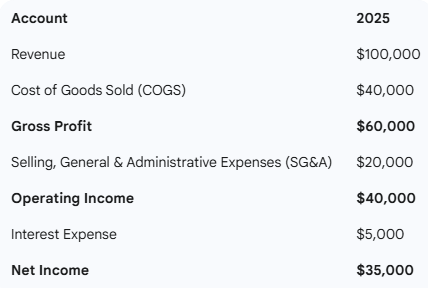
Here is an example of a simple financial statement and the corresponding XBRL.
A Sample Financial Statement#
XBRL Corresponding to the Financial Statement#
Notice that each line item, such as revenue and COGS, has a tag. This not only makes it easy to reconstruct the statement, but also facilitates search. Each company may have different line items (for example, some companies do not perform R&D), but can choose which tags to include in their statements. The system of XBRL tags is standardized and conforms to a hierarchy.
<?xml version="1.0" encoding="UTF-8"?>
<xbrl xmlns="http://www.xbrl.org/2003/instance">
    <context id="c2025">
        <entity>
            <identifier scheme="http://www.sec.gov/CIK">1234567890</identifier>
        </entity>
        <period>
            <startDate>2025-01-01</startDate>
            <endDate>2025-12-31</endDate>
        </period>
    </context>
    <unit id="u-monetary">
        <measure>iso4217:USD</measure>
    </unit>

    <us-gaap:Revenues contextRef="c2025" unitRef="u-monetary" decimals="0">100000</us-gaap:Revenues>
    <us-gaap:CostOfGoodsAndServicesSold contextRef="c2025" unitRef="u-monetary" decimals="0">40000</us-gaap:CostOfGoodsAndServicesSold>
    <us-gaap:GrossProfit contextRef="c2025" unitRef="u-monetary" decimals="0">60000</us-gaap:GrossProfit>
    <us-gaap:SellingGeneralAndAdministrativeExpenses contextRef="c2025" unitRef="u-monetary" decimals="0">20000</us-gaap:SellingGeneralAndAdministrativeExpenses>
    <us-gaap:OperatingIncomeLoss contextRef="c2025" unitRef="u-monetary" decimals="0">40000</us-gaap:OperatingIncomeLoss>
    <us-gaap:InterestExpense contextRef="c2025" unitRef="u-monetary" decimals="0">5000</us-gaap:InterestExpense>
    <us-gaap:NetIncomeLoss contextRef="c2025" unitRef="u-monetary" decimals="0">35000</us-gaap:NetIncomeLoss>

</xbrl>
Structured Data: The Ordered Database#
Structured data is the most organized and traditional form of data. It adheres to a predefined format, and the data elements are organized in a specific, consistent way.
Structured data is incredibly powerful for analytical tasks because its consistent format allows for efficient storage, retrieval, and manipulation using standard query languages like SQL (Structured Query Language). Its predictability is its greatest strength, making it the backbone of many business intelligence and reporting systems.
Characteristics of Structured Data#
Fixed Format: Data must conform to a rigid, predefined format.
Highly Organized: Typically stored in tables with rows and columns.
Easy to Query and Analyze: Its organization makes it straightforward to use with traditional database management systems and analytical tools.
Examples#
Relational Databases (SQL): Data is stored in tables, and these tables are related to each other. Think of databases powering banking systems, e-commerce sites, or university enrollment systems.
Spreadsheets (e.g., Microsoft Excel, Google Sheets): Perhaps the most familiar example for many. Data is laid out in a grid of rows and columns, with clear headings for each column.
Data Warehouses: Large repositories of structured data collected from various sources, designed for reporting and analysis.
Tabular Data: Our Focus#
Tabular data is the most common format for storing and analyzing data. Much data, from business to science, is tabular. Every time you used Excel, you worked with tabular data.
In our class, we will work exclusively with tabular data.
The Anatomy of a Table#
A table consists of rows and columns. The columns are the more important of the two because the columns define the table’s structure.
Table Columns#
Each table column (sometimes called a field or variable) stores one piece of information. For example, say you are creating a table to store information about students. You might create separate columns for student ID, first name, last name, major, and GPA.
Note that all data in a column should be of the same type (e.g., text, number), and should store the same information. You should not have separate columns for first and last name and then store the text “Smith, Jack” in one column while leaving the other blank.
Table Rows#
Each table row (sometimes called an observation or record) stores a complete piece of data. In the student example above, each row will store data for one student.
Conclusion#
Understanding the different types of data – unstructured, semi-structured, and structured – is important as you embark on your data analytics journey. Each type presents unique challenges and opportunities. While unstructured data offers rich contextual information and semi-structured data provides flexibility, structured data, particularly in its tabular form, remains the bedrock for most traditional and modern data analysis techniques. Mastering the organization and manipulation of tabular data is an essential skill for any aspiring data analyst.