A Company and its Data#
You decide to start a business. One of your passions is gourmet foods and you struggle to find foods that you like in your city. You therefore decide to become a distributor of these foods. You will purchase gourmet food items from suppliers in large quantities and resell them to retailers across the country. You decide to name your company Northwind Traders.
You have written a business plan and made financial projections. You have secured financing for your business. You have found a property to serve as your warehouse and office. At this point, it occurs to you that you need a plan for your business’s data. What data should you collect and what reports will you require on a regular basis? How should you store this data? Should you write your own software or use something “off the shelf” like QuickBooks? Even if you use QuickBooks, you still need to think about data collection and analysis because you will need to set up QuickBooks. As you think about this, you decide to make data your top priority. It will be the lifeblood of your business. You cannot determine the health of your business or manage your business without data.
Business Reporting#
You decide to begin your journey with data by thinking about the reports, analyses, and questions that you must answer. You will work backwards from these. You decide that your company will regularly need to generate the following:
Financial statements (balance sheet, income statement, cash flow statement). Your lenders and equity investors require these.
Product reports. You decide that you want to track product sales and profitability. You also want to track inventory levels over time and optimize your inventory replenishment policies.
Customer reports. How many customers do you have? Is the number of customers increasing over time, or are existing customers ordering more or less? Which customers account for the bulk of your revenues and profits? What are customers’ ordering patterns?
Employee reports. How many employees do you have? What are their roles? What does your org chart look like? Which employees are your top salespeople? Do you have a lot of turnover among employees?
Supplier reports. Which suppliers account (indirectly) for the bulk of your profits? Do some suppliers give you better terms than others?
Cash balance forecasting. You have credit lines with your suppliers, but your customers also have credit lines with you. You need to have enough cash on hand to make payroll and replenish inventory.
Shippers. As a distributor, shipping is one of your biggest expenses. Do some shippers charge more than others? Do some shippers take longer than others?
And last, but not least:
Orders. A customer order is the basic unit of activity at your company. You decide that you want to maintain detailed information on orders. Which customer placed the order, and with which employee? How long (on average) between order placement and fulfillment? How many items per order? Were these items profitable?
Data Needed#
For each of the reports in the previous section, you must make a list of all data items needed to generate those reports. From these, you can lay out database tables and the relationships between them. We will discuss these topics in detail in the next few chapters. Also, most commercial accounting software is designed with these requirements in mind and already has some data templates that you can use as a starting point.
Example: Microsoft’s Northwind Traders Database#
In the 1990’s, Microsoft created a sample database called Northwind Traders. This database was distributed with Microsoft Access and was intended to help users learn database concepts in a realistic business setting. Because of its ease-of-use, Northwind Traders is still used today.
The Northwind Traders database contains many tables. Below, I list some of the main tables. You can use these to generate the reports listed above. I omitted some tables that provide supporting information. In later chapters, I will discuss the relationships between tables.
Products Table#
There is one row per product that Northwind Traders stocks. Each row contains a product identifier, the product’s name, the product’s supplier, the product’s selling price and your cost, the number of units in inventory, the number of units on order, and the reorder level.
As you think about this, you wonder why the product’s price and cost are stored here. Might these change over time? If they do, don’t you need to track that somewhere for your financial statements?
Customers Table#
There is one row per customer. Each row contains a customer identifier, the customer’s name, point of contact, address, and phone number.
Employees Table#
There is one row per employee. Each row contains an employee identifier, the employee’s first and last name, title, birth date, hire date, address, phone, and a photo (yes, it’s possible to store photos in a database!).
Shippers Table#
There is one row per shipper that Northwind Traders uses. If this were a real company, this table would contain shippers like FedEx and UPS. However, since this is a fictitious company, fictitious shippers are listed. Each row contains a shipper identifier and the shipper’s name and phone number.
Suppliers Table#
There is one row per supplier that Northwind Traders uses. Each row contains a supplier identifier, the supplier’s name, point of contact, address, phone number, and web site URL.
Orders and Order Details Tables#
You notice that Northwind Traders has two tables that contain information about orders.
Orders Table
The orders table contains one row per order. Each row contains an order identifier, a customer identifier, an employee identifier, the order date, the ship date, the freight cost, and the ship-to address.
Order Details Table This table contains one row per order per item ordered. Thus, if an order consists of three items, there will be one row in the Orders table and three rows in the Order Details table. Each row in this table contains an order identifier, a product identifier, a price, a quantity, and the percentage discount applied.
As you think about this layout, it begins to make sense. Why is it not possible to all this information in one table?
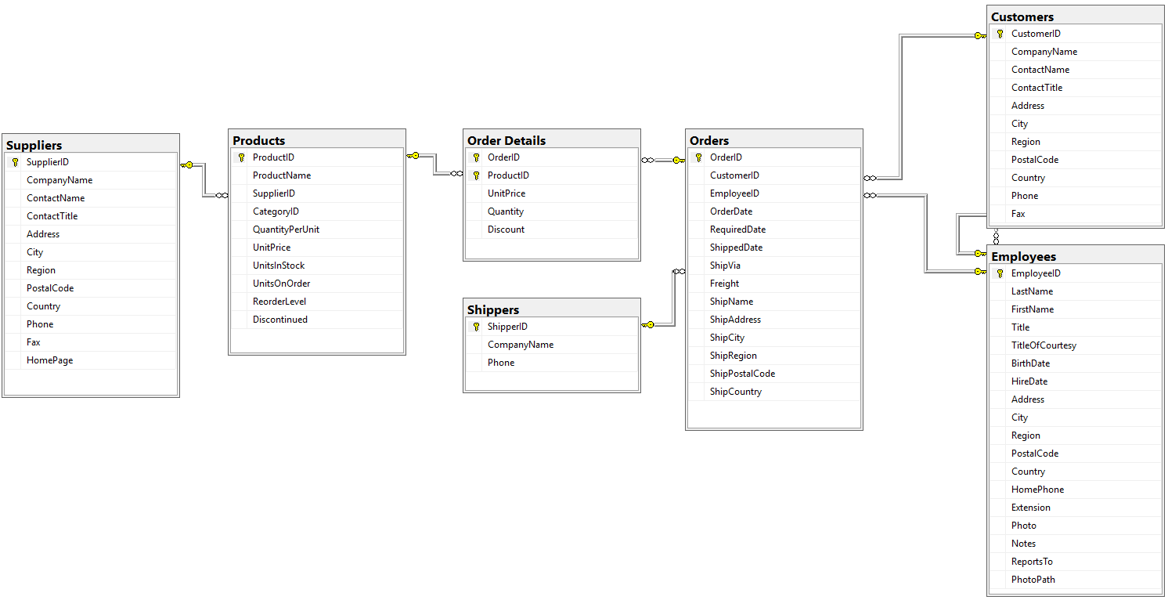
Relationship Diagram#
If it is difficult to remember the details about all the tables, you may find the following “relationship diagram” useful. It shows all the tables in the database. It also shows links between the tables.
Consider the Suppliers and Products tables on the left side. Each product must have one, and only one supplier (in the real world, it is possible to have multiple suppliers of the same product, but let’s assume that is not the case here). This is denoted by the kinked line between the Suppliers and Products table. Notice that there is a key symbol at one end of the line, and an infinity symbol at the other (the infinity looks like two circles, but it’s actually an infinity ∞). The key means “one”, and the infinity means “many”. That means that each product must have one, and only one, supplier. Each supplier, however, can be associated with multiple products. Also notice that the line connects the SupplierID columns in both tables. That means that the number in the SupplierID column in the Products table must match a SupplierID in the Supplier table. This is a way of ensuring data integrity.
Conclusion#
Businesses constantly think about data. They must decide which data to collect, given their reporting requirements. Once that is known, they must organize their data in a manner that reduces the chance of data errors while allowing for efficient retrieval for reporting purposes. This is an ongoing process and is one reason why chief information officers (CIO’s) and IT consultants are well compensated.
In the next few chapters, you will learn how business data is stored in databases. In the next unit, you will learn how to retrieve, transform, and aggregate that data.